The Problem
Ops teams rely on messy spreadsheets
In transportation, logistics, and package operations, teams still rely on countless CSVs and pivot tables just to see what's happening. Operators spend more time fixing formulas than finding solutions.
Excel Overload
Hours wasted on manual data manipulation
The Solution
Upload → Map → Discover
OpsInsite transforms your operational chaos into clear insights. Upload any file with dates, metrics, and groupings. Map your fields in seconds. Instantly unlock dashboards and deep dives.
Instant Setup
Minutes, not hours to get insights
Smart Analytics
AI-powered insights from your data
Key Features
Everything you need to transform your operations data into actionable insights
Summary Reports
Auto-generated charts that show you the big picture by your key metrics and groupings — no setup needed.
In Depth
Dive deeper into your data. Compare metrics and segments, slice by different timeframes, and spot trends that spreadsheets hide.
Flow Analyzer
Visualize your flows and bottlenecks. See how shipments move, where delays stack up, and where you can act first.
Scan Event Analyzer
Break down every scan step in a shipment's journey. Set benchmarks to see what's on track and what's falling behind.
Intra Day Processing
Zoom in on your process rates by hour or time segment. Optimize staffing and throughput based on when and where work really happens.
Ask Your Data
No more waiting for analysts. Ask a question in plain language — OpsInsite uses AI to write the code, run it, and give you answers.
How It Works
Transform your operations data in three simple steps
Upload Your File
Any file with a date, a metric, and a grouping. CSV, Excel, or any format.
Map Your Fields
Our smart mapping detects your columns automatically. Adjust in seconds.
Instantly View Reports
Unlock dashboards, charts, and deep dives to understand your operations.
See It in Action
Real dashboards, real insights, real results from your operations data
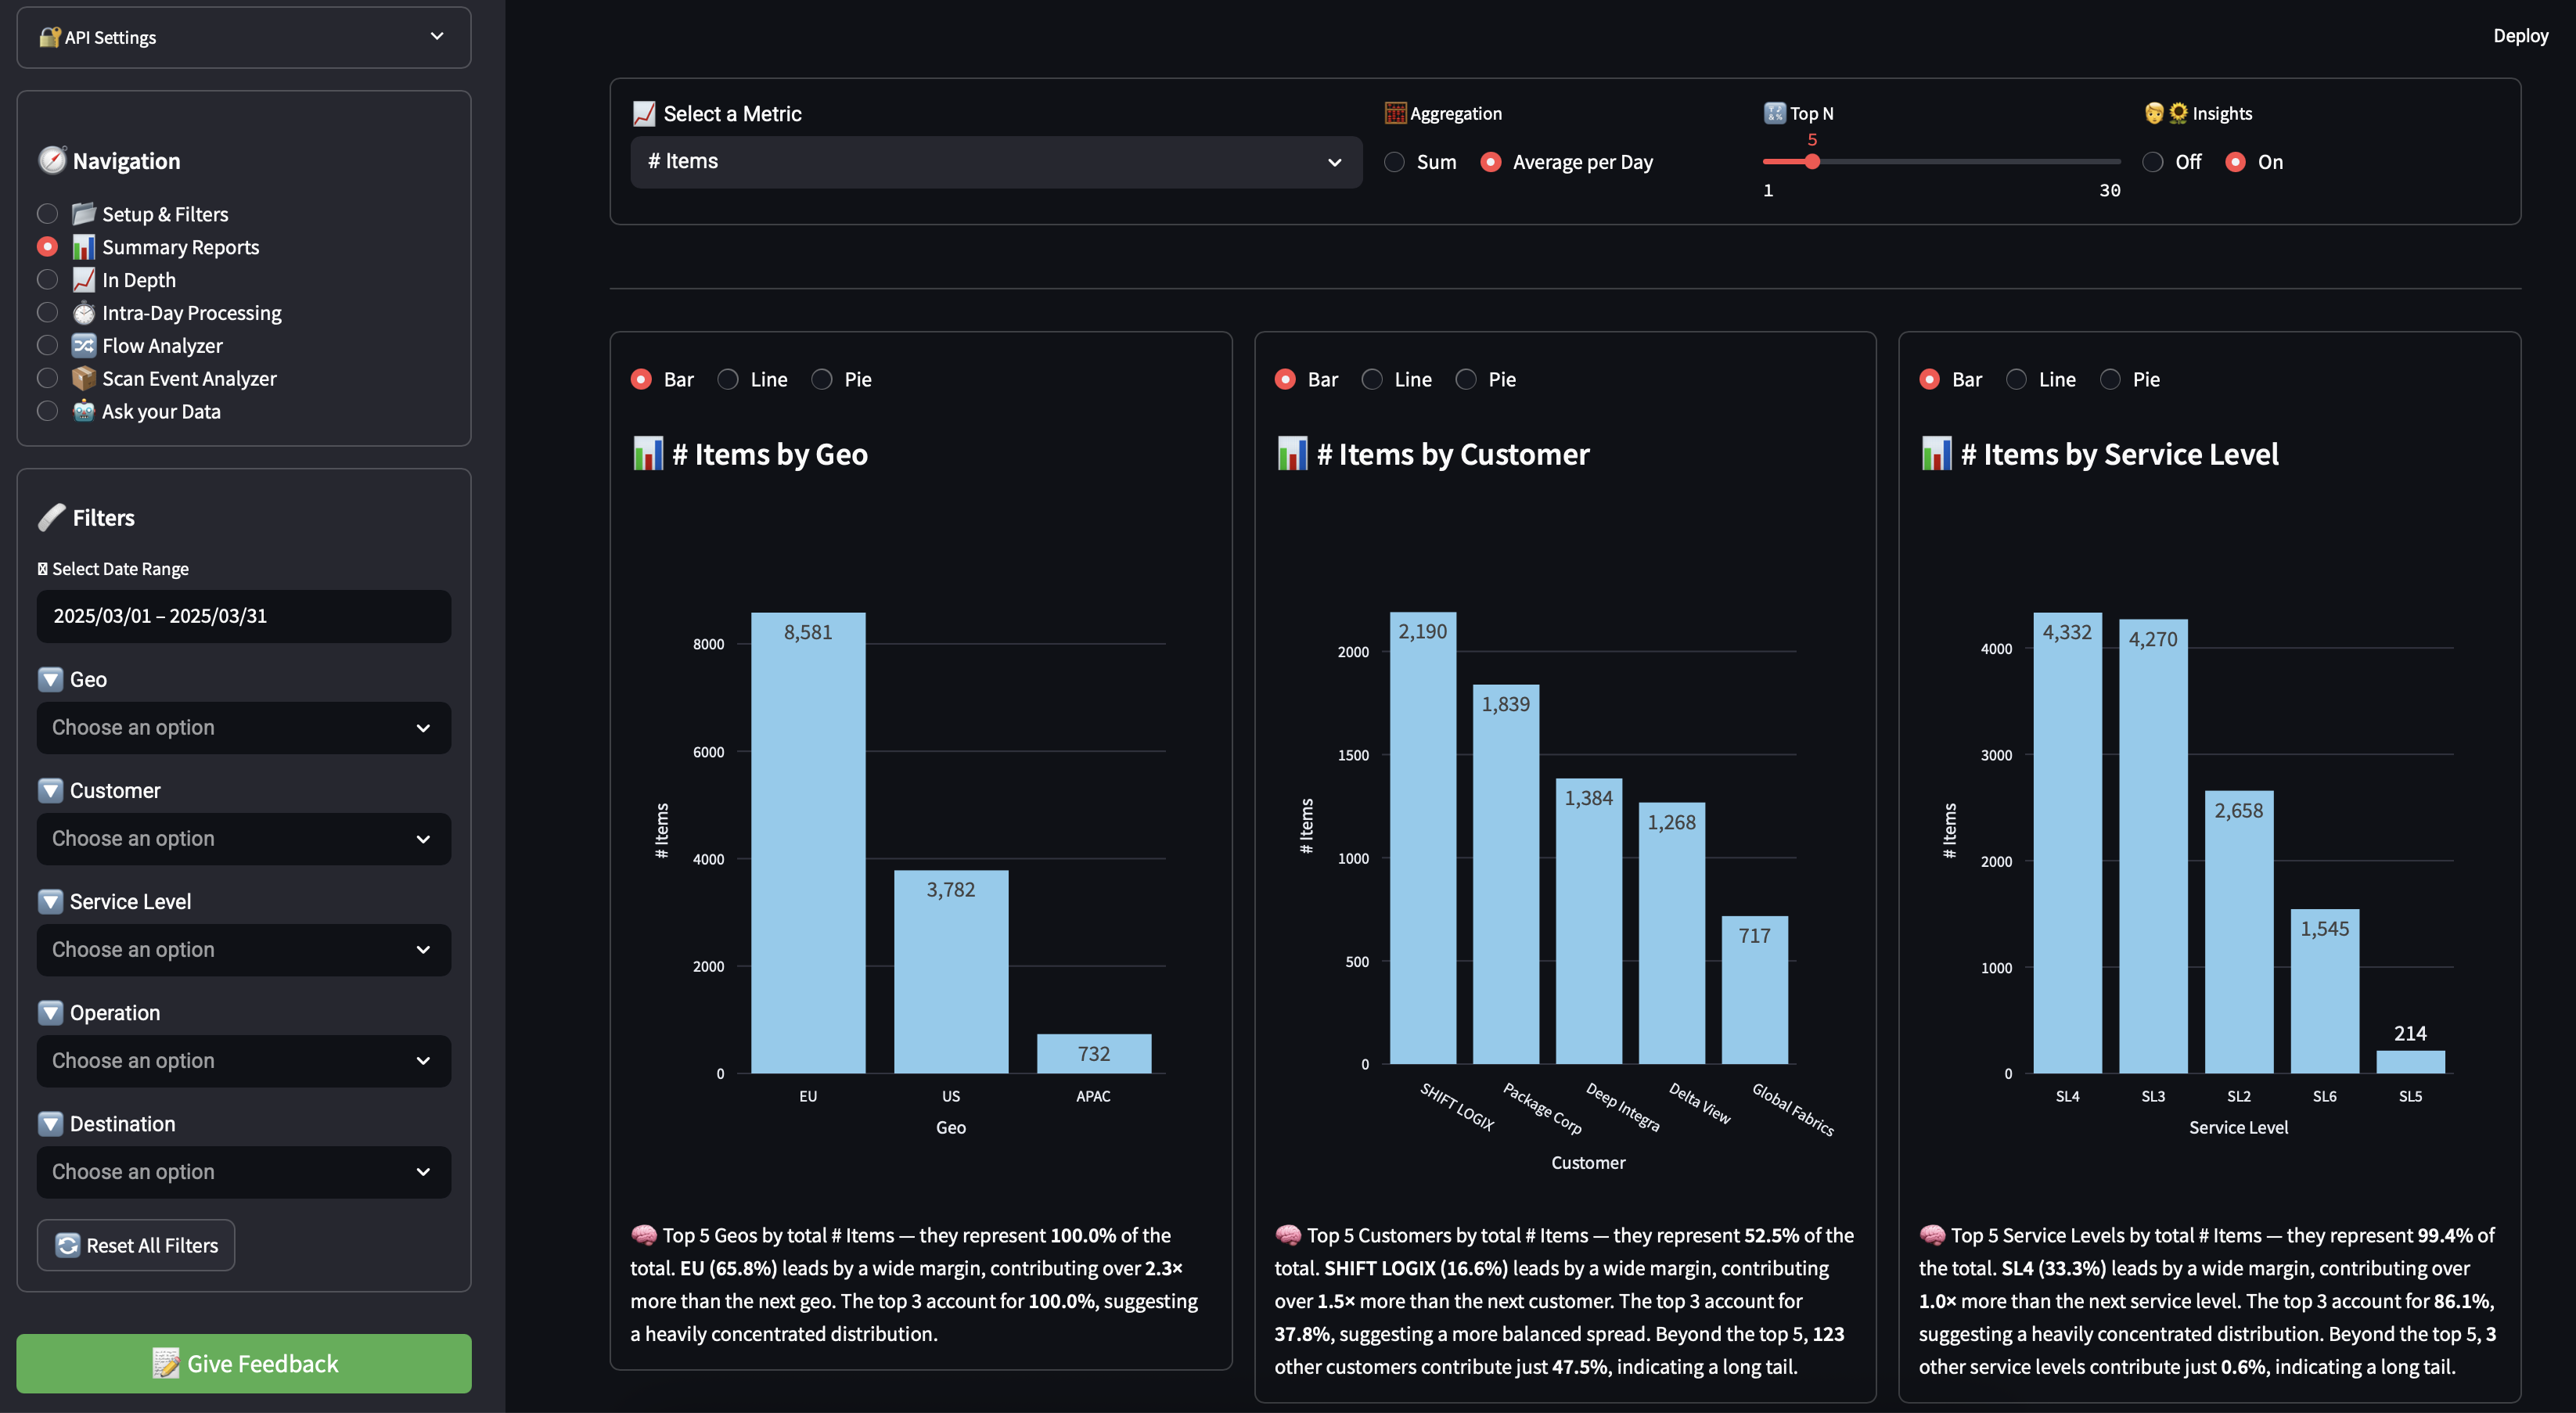
Summary Reports
Get the big picture with auto-generated charts and insights
Built for Operators, by Operators
Unlike generic BI tools, OpsInsite speaks the language of operations. It's designed to get you to answers faster, with zero fuss — so you can spend your time fixing processes, not fixing spreadsheets.
Speaks the language of operations, not generic BI
Get to answers faster with zero setup complexity
Spend time fixing processes, not fixing spreadsheets